Last month I attended a superb presentation on JBoss Cache by the project lead, Manik Surtani. Luckily only six people showed up, so were were able to chat to Manik, and really pick his brains on this stuff. Talking to Manik gave me a huge amount of confidence in the JBoss Cache product.
Some background to all of this: we’ve all probably kept something that’s frequently used, and infrequently changing, in memory to save a trip to a database. That’s one of the things you can use a cache like JBoss Cache for, but that are other benefits too: the preference for code that’s been written elsewhere (many eyes etc); a smart way to do invalidation; a way to distribute a cache between servers; reporting tools… and so on.
JBoss Cache isn’t the only solution out there. There are a bunch of APIs you can use to add caching into your application, and maybe one day the Java Temporary Caching API (JSR 107) standard will mean you can use one API across all the implementations. I was wondering… how do they compare. I decided to have quick look at performance for three of the popular ones.
I’m looking at:
- JBoss Cache, version 2.0.0 RC3. LGPL license.
- JCS: Java Caching System, version 1.3. Apache license.
- Ehcache, version 1.3. Apache license.
I have a scenario in mind, where there are a lot of cache hits and only a few cache stores. In particular I wanted to know how the implementations perform under concurrent access, such as a heavily loaded web site: what happens to the cache performance as load increases.
To set the stage here’s a graph showing the performance of a work load
when using the ye olde synchronized Hashtable, the spanky new
ConcurrentHashMap and a “noop” implementation that neither stores nor
returns anything. The idea here is just to provide a sanity check of how
my laptop performs under increasing load.
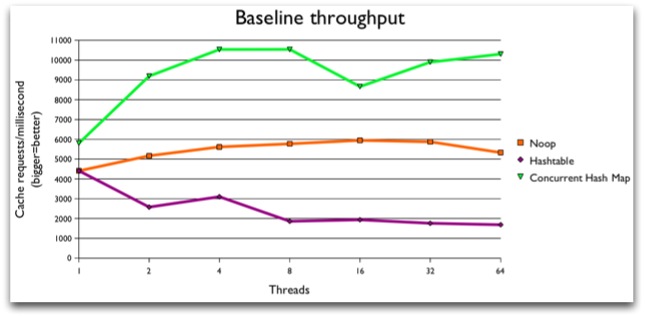
Here’s what you’re looking at. Along the x-axis is the number of threads concurrently accessing the cache. The y-axis is showing normalized throughput (so bigger is better on the y-axis), averaged over 5 runs. What I’ve done is create a worker that picks a random number, looks in the cache to see if it’s there, and if it’s not it associates a list against the number. There are only 400 numbers to pick from, and the worker tries this 40,000 times (weird numbers, but it’s relevant to the application I have in mind). Each thread equates to one worker, and all the workers share the same cache instance. You can download the source code for this, if you want the details.
So focus on the orange curve in the middle first, which is the graph for my “noop” cache. It’s doing pretty much what you’d expect. As the number of threads increases, the machine is able to perform more operations in the same amount of time, up to around 32 threads. After that, performs starts to fall off.
The purple line tells you that you don’t want to use a Hashtable for
concurrent access. There’s a lot of synchronization and waiting
happening (probably) as threads compete to access the shared object.
The green line shows you that the concurrent APIs in Java have come a
long long way since Hashtable. The ConcurrentHashMap implementation
is blazing fast and doesn’t seem to suffer too badly under increasing
load. In fact, it has a better throughput than my noop code (possibly
because noop always causes both a get and a put on the cache).
So much for the baseline measurements. Now let’s see what happens with the Java caching implementations:
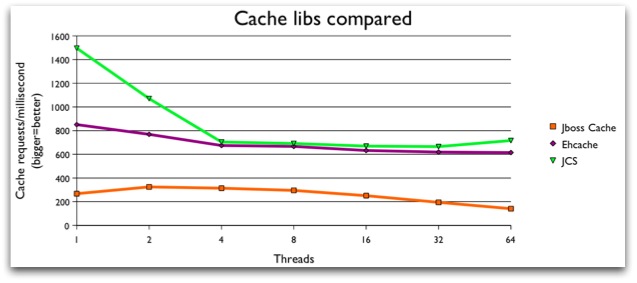
The first thing I need to say is that these tests are for local, non-replicated, non-transactional caching. I.e., it’s the simplest case. I’ve also only done the bare minimum configuration on the caches to make them work. I’m sure they are tweekable. Also note that the y-axis values are an order of magnitude lower than the baseline graph.
It looks like JCS have really tuned the single thread case, but after that there’s not a lot to choose between that and EHcache in terms of performance. Neither seem to suffer under increasing thread load. On the whole, I prefer the JCS API to the EHcahce one.
Don’t be overly put off by the JBoss performance curve. Sure it looks a lot lower, but we’re talking a total of 300ms difference at 4 threads for a total of 160,000 cache requests: there are bigger considerations that those performance measures.
So the conclusion from all of this is… they’re all pretty good. I was hoping one would run so badly I could rule it out, but that’s not the case, and I’m going to have to look at features.
For the simple case, I’m going to opt for JCS based on these numbers; but beyond that the numbers tell you nothing of use. For example, if you need transactional support, or want an object cache, then it has to be JBoss as that’s the only one with those features. Or you may prefer one API other the others in terms of style.
As a final comment, do not trust these curves for replicated or distributed caches: the issues there in measuring performance add a lot of complexity.