
Coursera’s AI for Medicine specialism includes a nice, short, set of videos that explain standard model evaluation metrics. I found it useful, and made a few notes.
Interpreting accuracy in terms of probability
If accuracy of a model is P(correct), we can break that down as the sum of joint probabilities.
P(correct ∩ disease) + P(correct ∩ normal)
That is: it’s the probability of being correct and having the condition (disease) plus the probability of being correct and not having the condition.
We can re-write that as:
P(+ve | disease) P(disease) + P(-ve | normal) P(normal)
So this interesting: looking at the first half of that expression before the +, P(correct ∩ disease) is the same as the probability of being correct given the person has the disease (i.e., predicting positive class) multiplied by the prevalence of the disease.
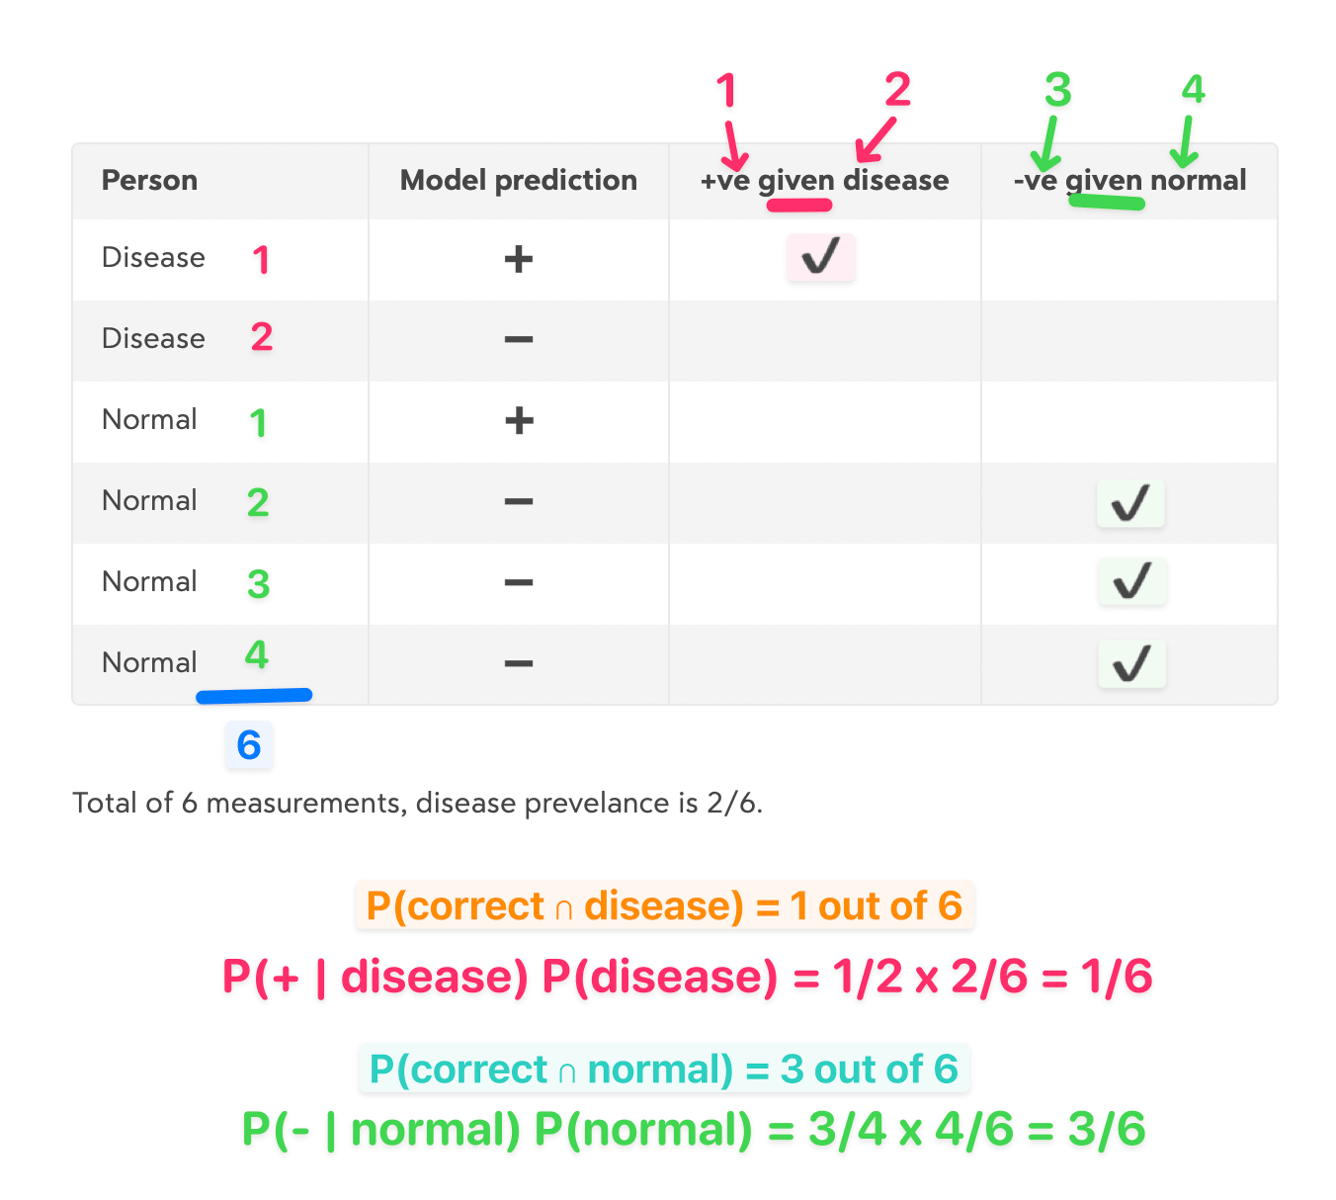
That feels right, but I decided to hand crank the numbers to convince myself via worked example of accuracy of 0.5, broken down into individual elements:
Interpreting probability as sensitivity and specificity
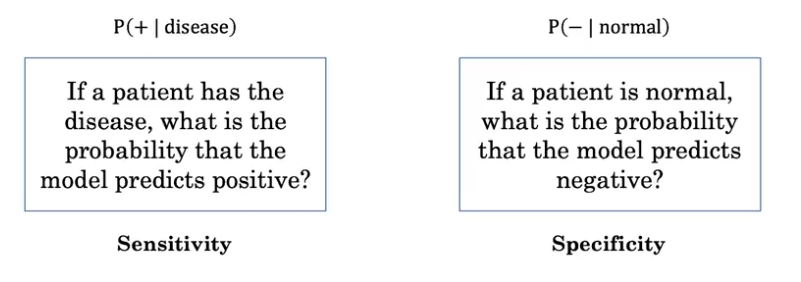
The course also points out that sensitivity and specificity are in there:
- Sensitivity (recall, true positive rate) is: P(+ve | disease)
- Specificity (true negative rate) is there too: P(-ve | normal)
This means accuracy is a weighted average of sensitivity and specificity:
sensitivity × prevalence + specificity × (1 - prevalence)
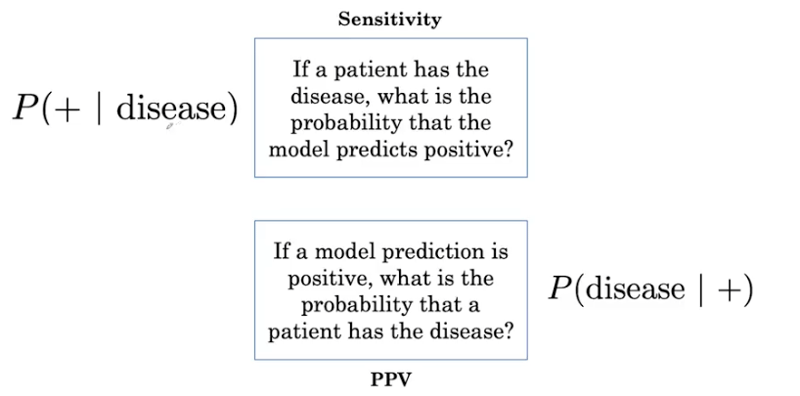
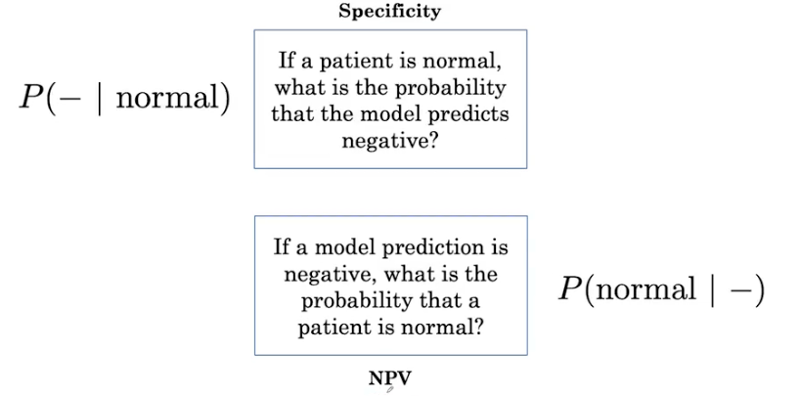
PPV and NPV
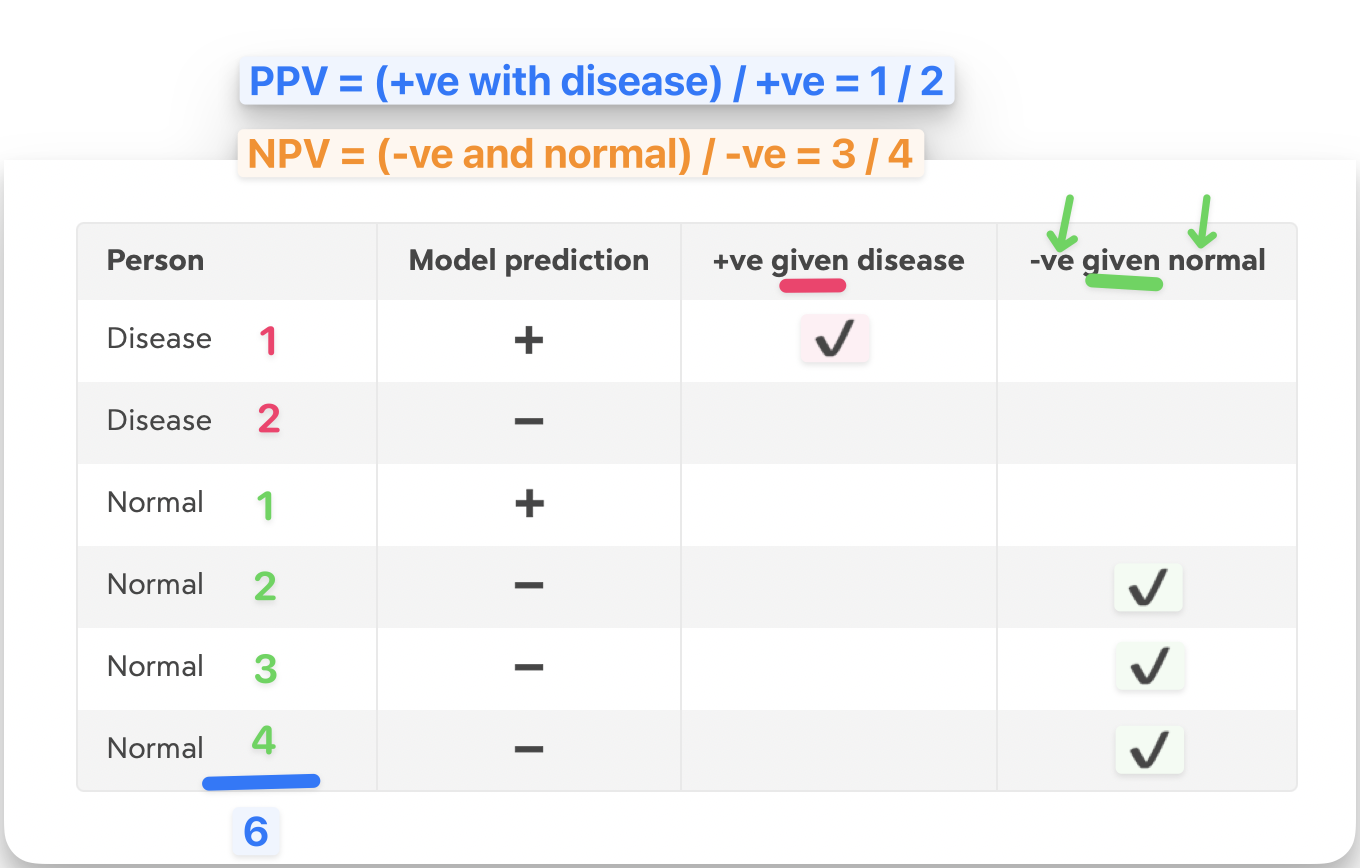
I’m told clinicians may be more interested in a variation: what is the probability of someone having a disease, given that the model predicts disease? This is the Positive (or Negative) Predictive Value (slides from the course):
Cranking the numbers again:
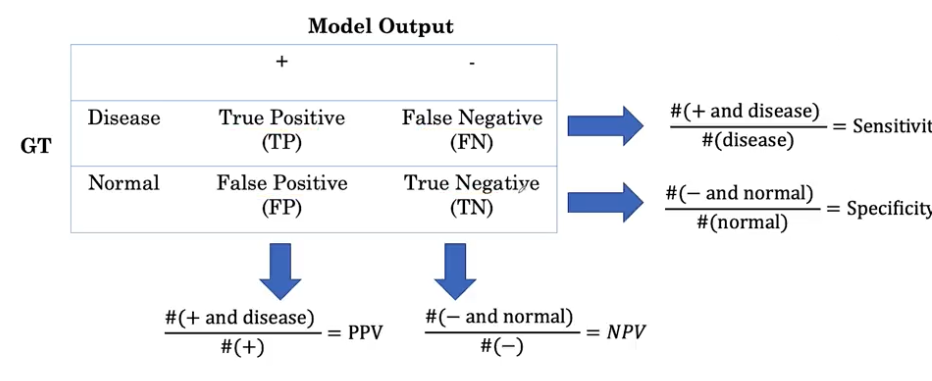
Confusion matrix
All these values can be found from a confusion matrix:
Other parts of the course
It’s a short set of videos, but very nicely done. It also covers ROC curves and thresholds.