
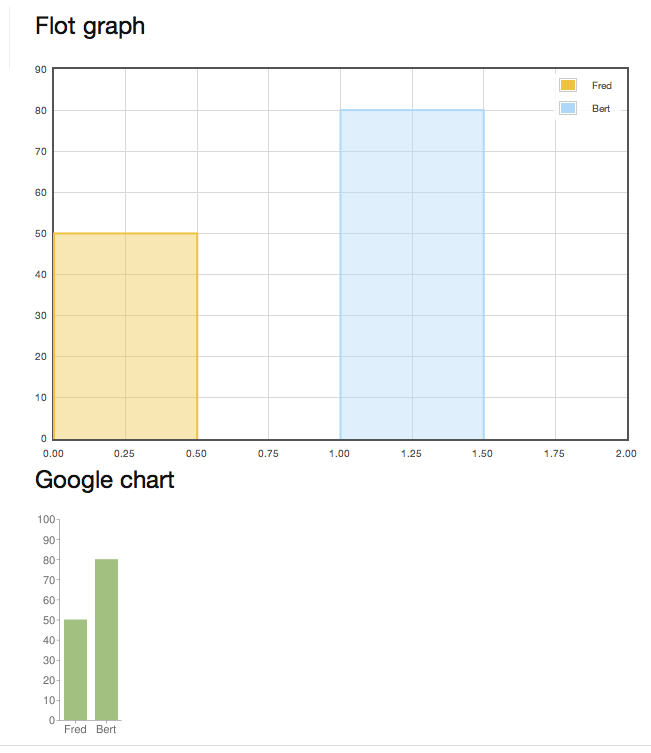
The other day at the London Scala User Group I was asked about creating charts and graphs in Lift. The two ways that sprung to mind were to use Flot and Google Charts, so I’ve posted example source code for creating a bar chart both ways. I probably should have made them look the same, but hey, it’s just an example to hack with.
All the code that matters is in one file.