
Reading: Global Healthspan-Lifespan Gaps Among 183 World Health Organization Member States, JAMA Network Open, 11 December 2024.
Life expectancy grows, but years lived without disease are not catching up: the “healthspan-lifespan gap” has increased.
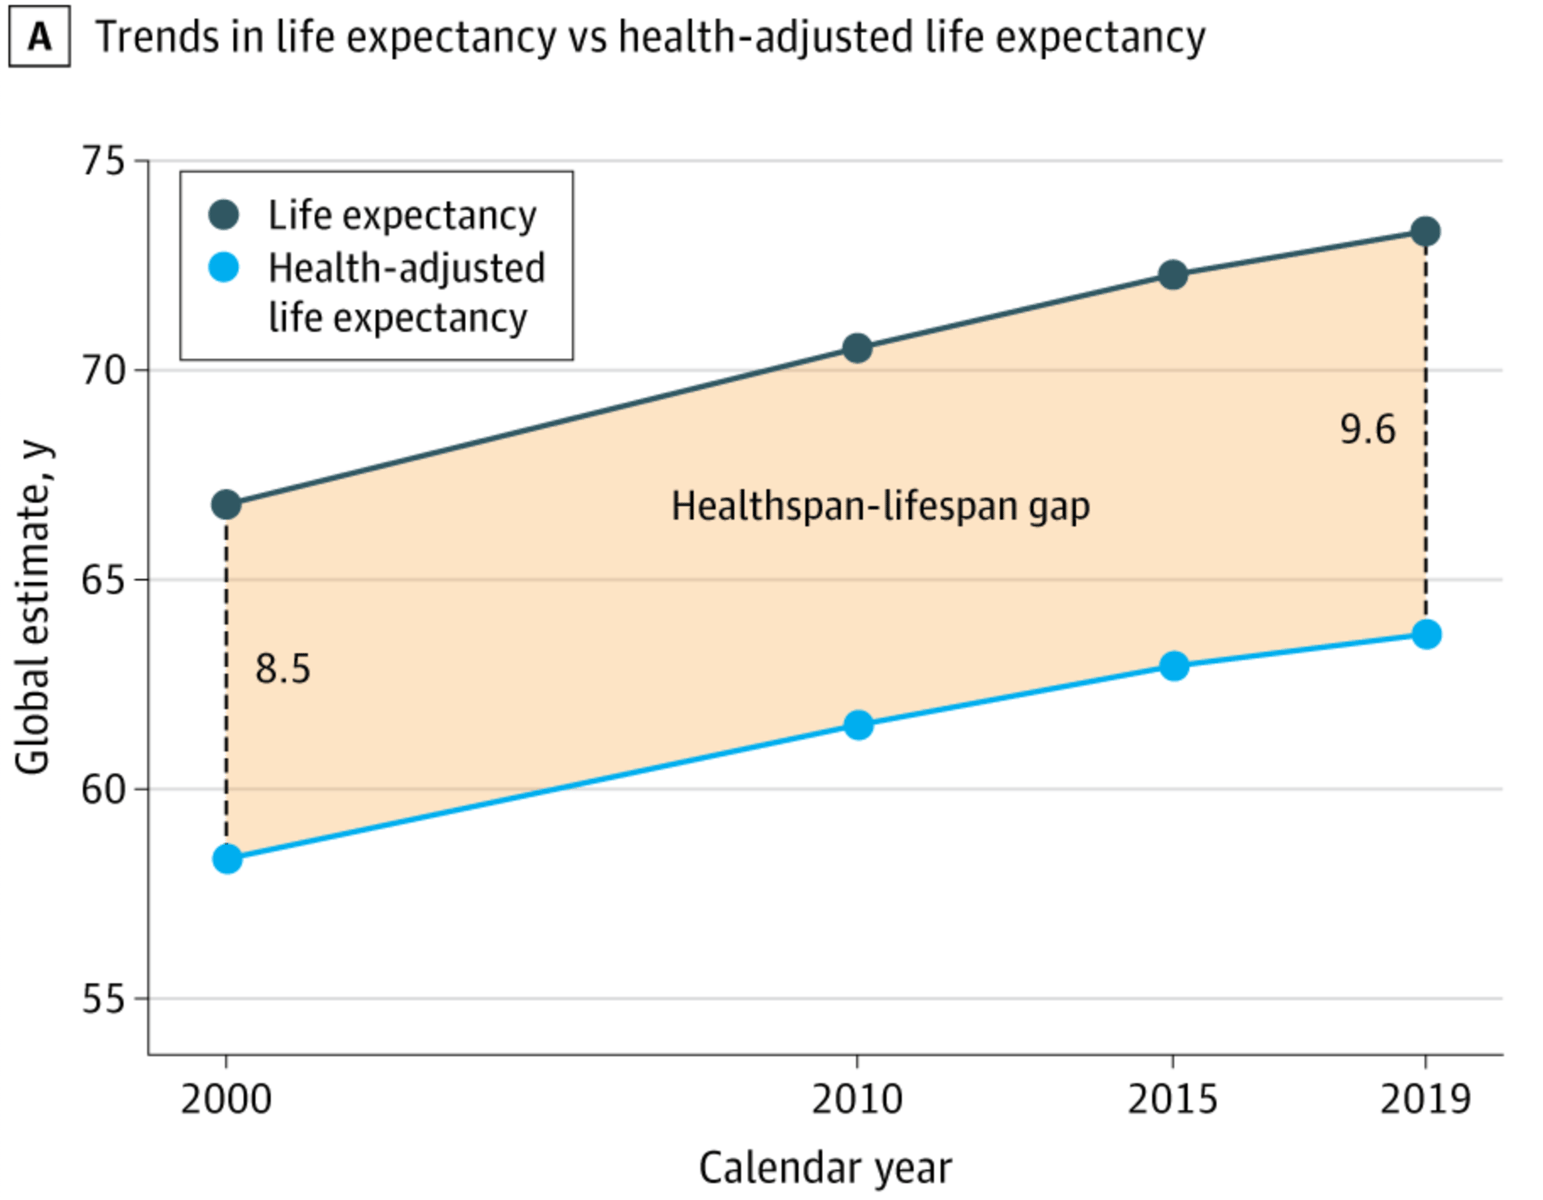
There are two things being measured here:
- life expectancy—or lifespan—which is how long you live.
- Health-adjusted life expectancy, which is an estimate of how long you live without ill heath (without disability").
The difference is the “gap”, and ideally you’d like the gap to be small.
The growing incongruity between longevity and healthy longevity implicates a disease paradox whereby reduced acute mortality exposes survivors to an increased burden of chronic disease.
Well, that’s annoying.
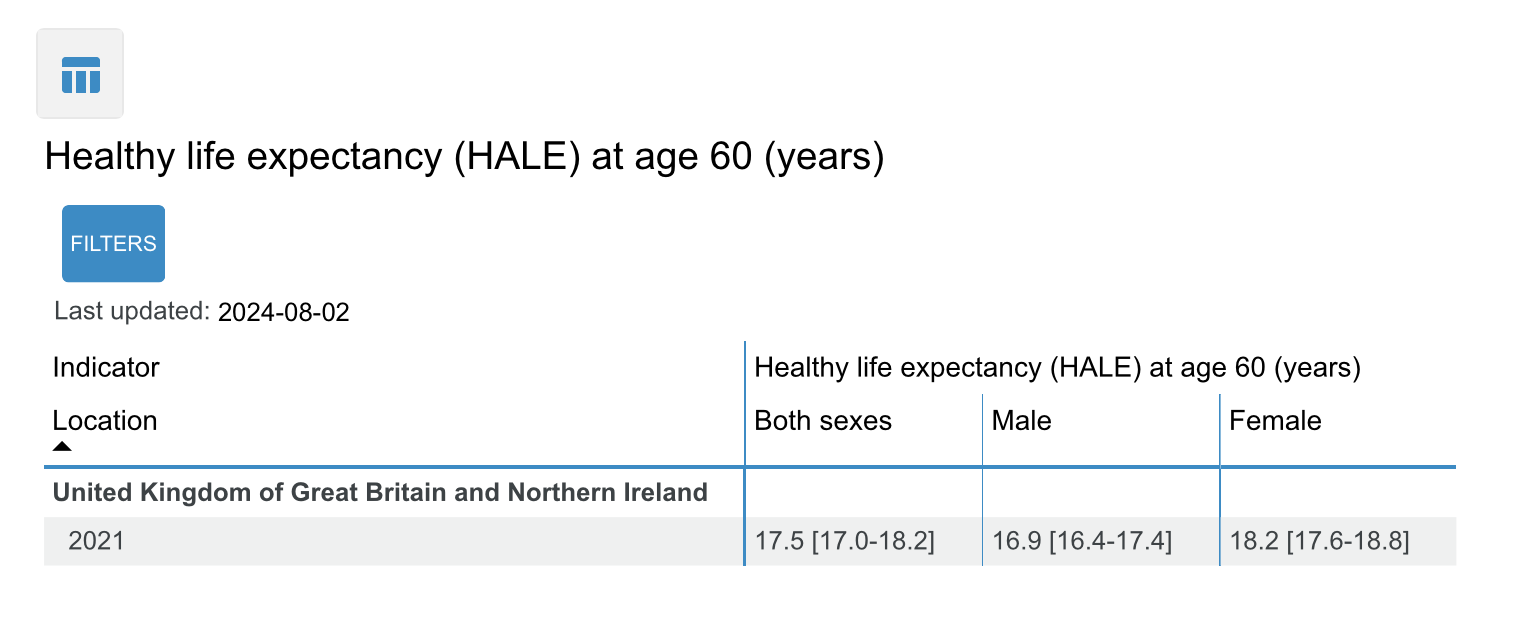
What is health-adjusted life expectancy (HALE)?
The HALE value for a given age is the sum of years without disability (YWD) until death, divided by the number of people alive at the given age. It’s how many years you can expect to live in full health (given current circumstances).
YWD looks like a pretty involved estimate, which has to deal with comorbidity and judgements over what is and isn’t a disability. The WHO publish this data which you can query:
Downloading that data I can plot the changes over time:
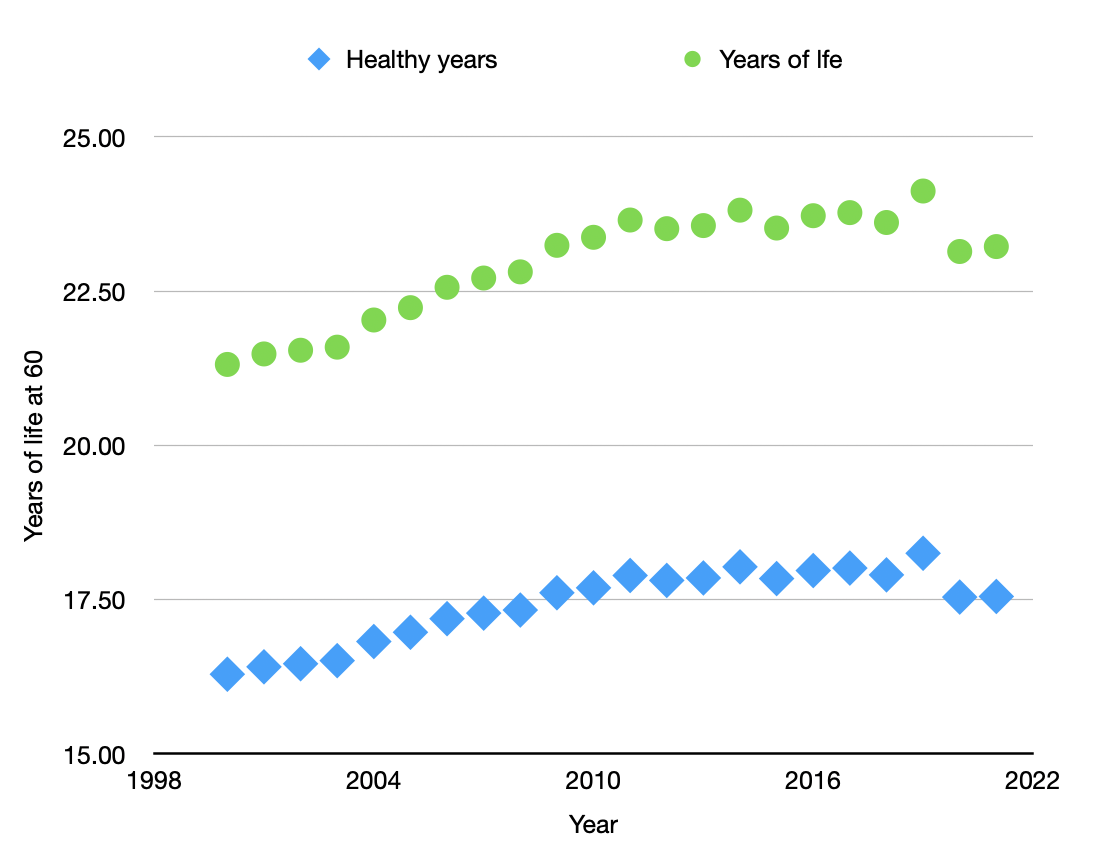
In the UK, it looks like the gap has grown over the last 20 years by almost 6 months.