
The Gene Expression Omnibus (GEO) is a repository of biological sequencing data. A research paper might deposit data in GEO as a number of files, either to allow others to replicate the work, or so the data can be used for a different analysis.
For example, the paper “Single-cell transcriptome analysis reveals differential nutrient absorption functions in human intestine” took human cells and carried out single cell RNA-seq analysis. The RNA “reads” from RNA-seq are mapped back to a reference genome, so you can estimate what genes are "switched on” (or off) in the cells. They put this data in GEO.
These are my notes on interpreting these files.
File names
Everything has a unique accession number:
- GSMxxxxxx - sample record (for example the expression data from a person).
- GSExxxxxx - series, a group of samples.
- There are other files, such as platform files (GPLxxxx) which identify how the sample was collected.
The above paper references a series, made up of 6 samples which goes by the code “GSE125970”.
There are a variety of file formats in a series. There are commentary or meta data family files, and then there’s the data proper.
Family files
Examples are:
- A 14k tab-delimited Series Matrix file, which could contain expression data, but in this case points to supplementary files for that.
- A 22k XML file containing much the same. The format is MINiML.
- SOFT files (Simple Omnibus Format in Text), discontinued in 2024 but there are tons of them around. In the paper I’m looking at, this file lists the samples and describes the processing steps. It’s 20k in size and similar to the series matrix file.
Data files
The big files are the data themselves. The files end .txt they are tab separated. I rename them as .tsv to make them easier to work with via tools like qsv.
The 454M “GSE125970_raw_UMIcounts.txt” has rows representing genes, and columns representing cells. In this specific study, six tissue samples were taken, and individual cells identified with a DNA barcode, and then analysed for RNA activity.
There are 14,537 cells measured against 19,525 genes. It looks like this:
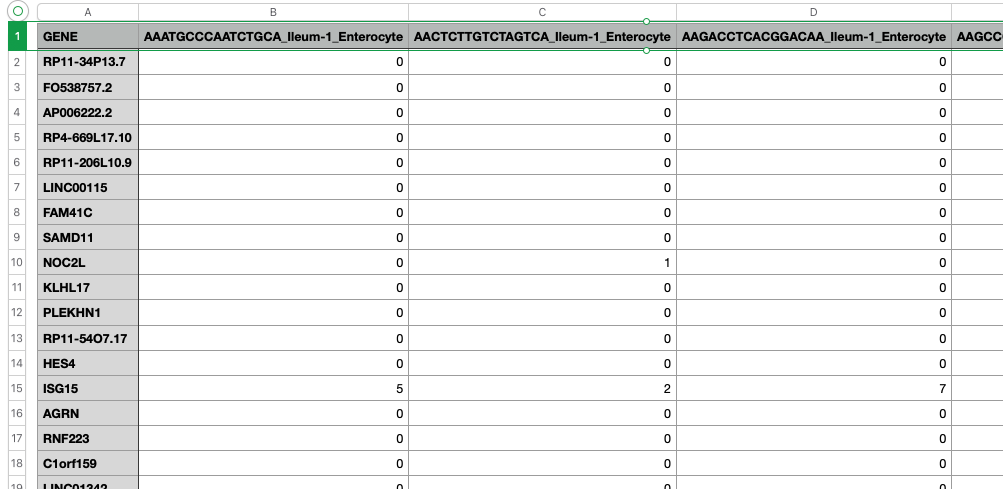
There’s also a scaling and normalization process which I don’t yet understand, which turns the values into floating poiint numbers from something like -10 to 10. You’ll find that in a 4.8G “GSE125970_scale_data.txt” file. It’s much larger because it’s now full of floating point numbers.
That’s what gene expression data looks like.