
Reading: AI hallucinations can’t be stopped — but these techniques can limit their damage, Nature, 21 January 2025.
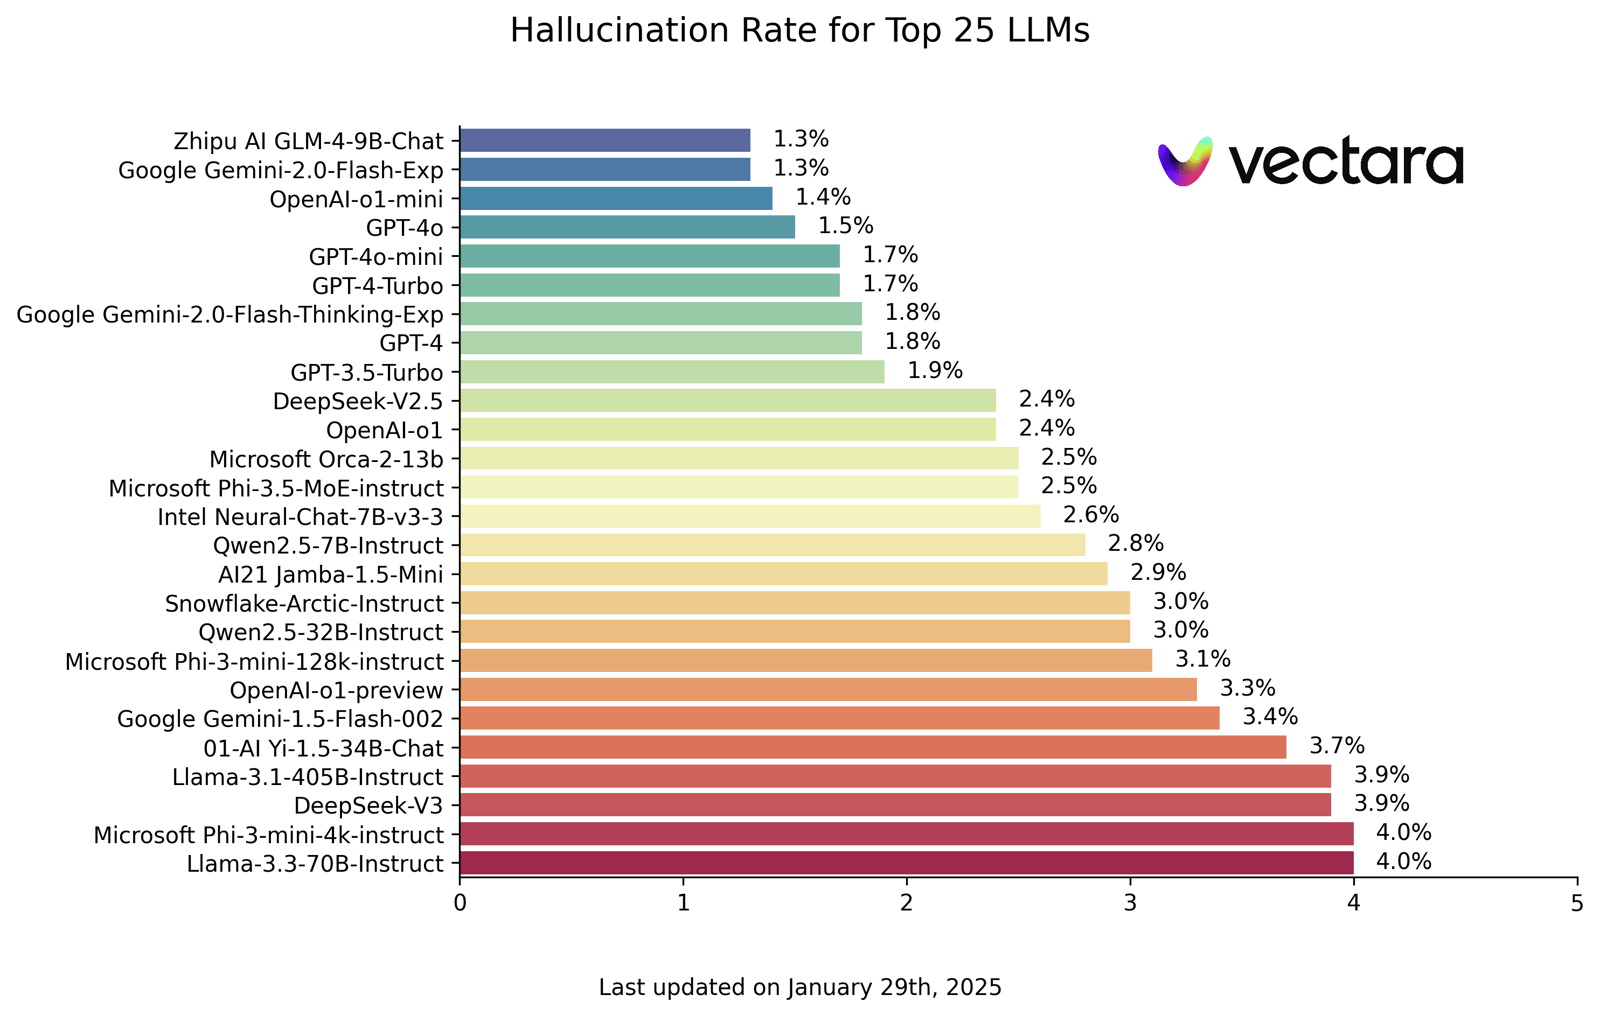
The part of the report that caught my eye was a chart showing the best models having a “hallucination rate of 1.3%":
What does hallucination rate mean?
The conclusion I’ve come to—and I’ll show my workings in a moment—is that hallucination rate is: the proportion of LLM generated texts that likely has at least one hallucination, according to a prediction from a hallucination detection model.
Here’s how I got there. The Nature news article gives this definition: “Vectara’s Hallucination Leaderboard grades large language models (LLMs) on the specific task of summarizing a provided document, by tracking how many details they make up."
The way Vectara has done that is to score LLM generated text against support found in text provided to the LLM. As they put it:
You always need two pieces of text to determine whether a text is hallucinated or not. When applied to RAG (retrieval augmented generation), the LLM is provided with several pieces of text (often called facts or context) retrieved from some dataset, and a hallucination would indicate that the summary (hypothesis) is not supported by those facts (evidence).
It’s a subtle problem in that an hallucination might be something true, but either irrelevant to the question or not in the (limited) supplied context. It seems like a good way to score summarisation or document retrieval.
The next question becomes: how do you judge if the generated text is supported or not? What Vectara did was build a model. From their API docs:
Vectara uses the
Hughes Hallucination Evaluation Model(HHEM) to assess the likelihood of AI-generated summary being factually consistent based on search results. […] For example, a score of0.95suggests a 95% likelihood that the summary is free of hallucinations and would align with the original content.
So it’s a model itself, trained on pairs of (source text, summary text) to predict the likelihood the summary is hallucination-free. So bigger numbers are better there.
It’s on the leaderboard itself that you see what the published rate means. Looking in the “About” tab:
Hallucination Rate: Percentage of summaries with a hallucination score below 0.5
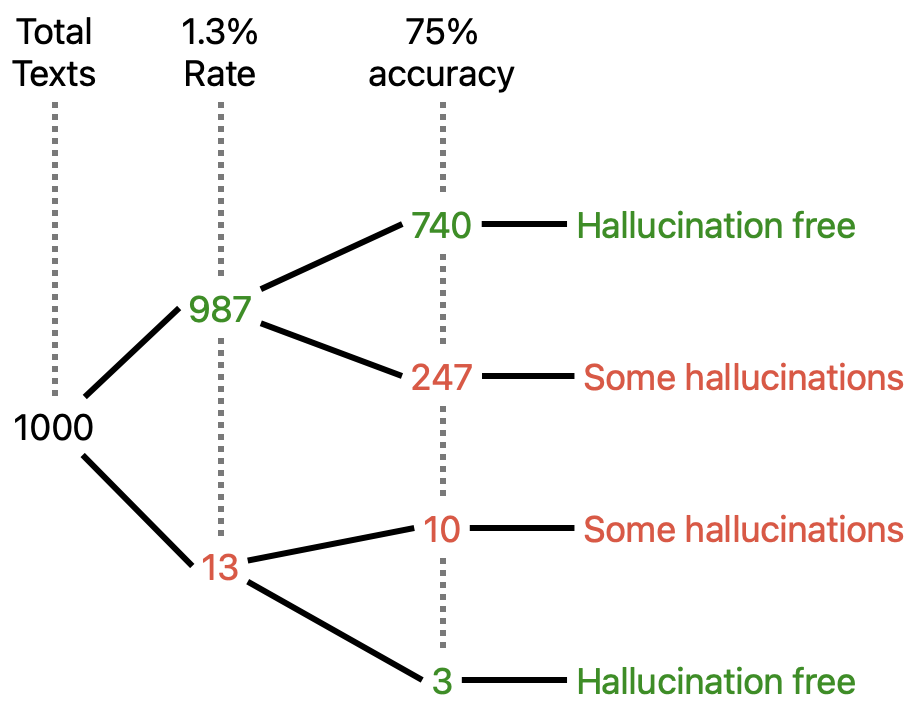
So finally we can say a 1.3% hallucination rate means: 1.3% of your summaries have a 50% (or higher) chance of containing hallucinations. In 1000 pieces of generated text, 13 will likely contain hallucinations.
Or if you prefer: 98.7% of your summaries have a 50% (or higher) chance of being hallucination-free. In 1000 pieces of generated text, 987 will be hallucination free.
Is that a good metric? It’s going to depend on how good the hallucination-detection model is, which seems to be around mid-70% accuracy.
Ways to reduce hallucinations
With that out of the way, the article goes on to describe approaches to reducing hallucinations.
- Use a bigger model.
- Have a model cite the data source.
- Use another system to fact-check against an internet search or similar.
- Use chain-of-thought or similar techniques to flush out poor “reasoning”.
- Ask the LLM “are you sure about that?”
- Ask multiple times, and high diversity of answers may indicate low confidence in the answers.
- Look for patterns in the internal representations that might indicate uncertainty.
There’s a lot of work in each of those approaches. For now we’re stuck with this:
“They sound like politicians,” says Santosh Vempala, a theoretical computer scientist at Georgia Institute of Technology in Atlanta. They tend to “make up stuff and be totally confident no matter what”.
* * *
I’ve noticed that Google DeepMind have a similar initiative: FACTS Grounding: A new benchmark for evaluating the factuality of large language models, 17 December 2024.
There’s also AIMultiple’s AI Hallucination: Comparison of the Most Popular LLMs.